Automating the data analysis process in the structural health monitoring of an in-service railway viaduct
FRANCESCO TURRIZIANI
Structural health monitoring of civil engineering structures is playing an increasingly important role in the field. The growing adoption of systematic data-processing methods — already well established in many other sectors and now increasingly present in this one — is reshaping, on a large scale, the approach to structural inspection and diagnostics.
In most cases, monitoring has historically been limited to data storage and the verification of fixed threshold exceedances, without any systematic processing of the raw data. Software tools capable of converting acquired data into adaptive thresholds and kinematic parameters derived from time series are now becoming increasingly widespread, delivering near real-time output in support of technical decision-making, both during the operational phase and during construction.
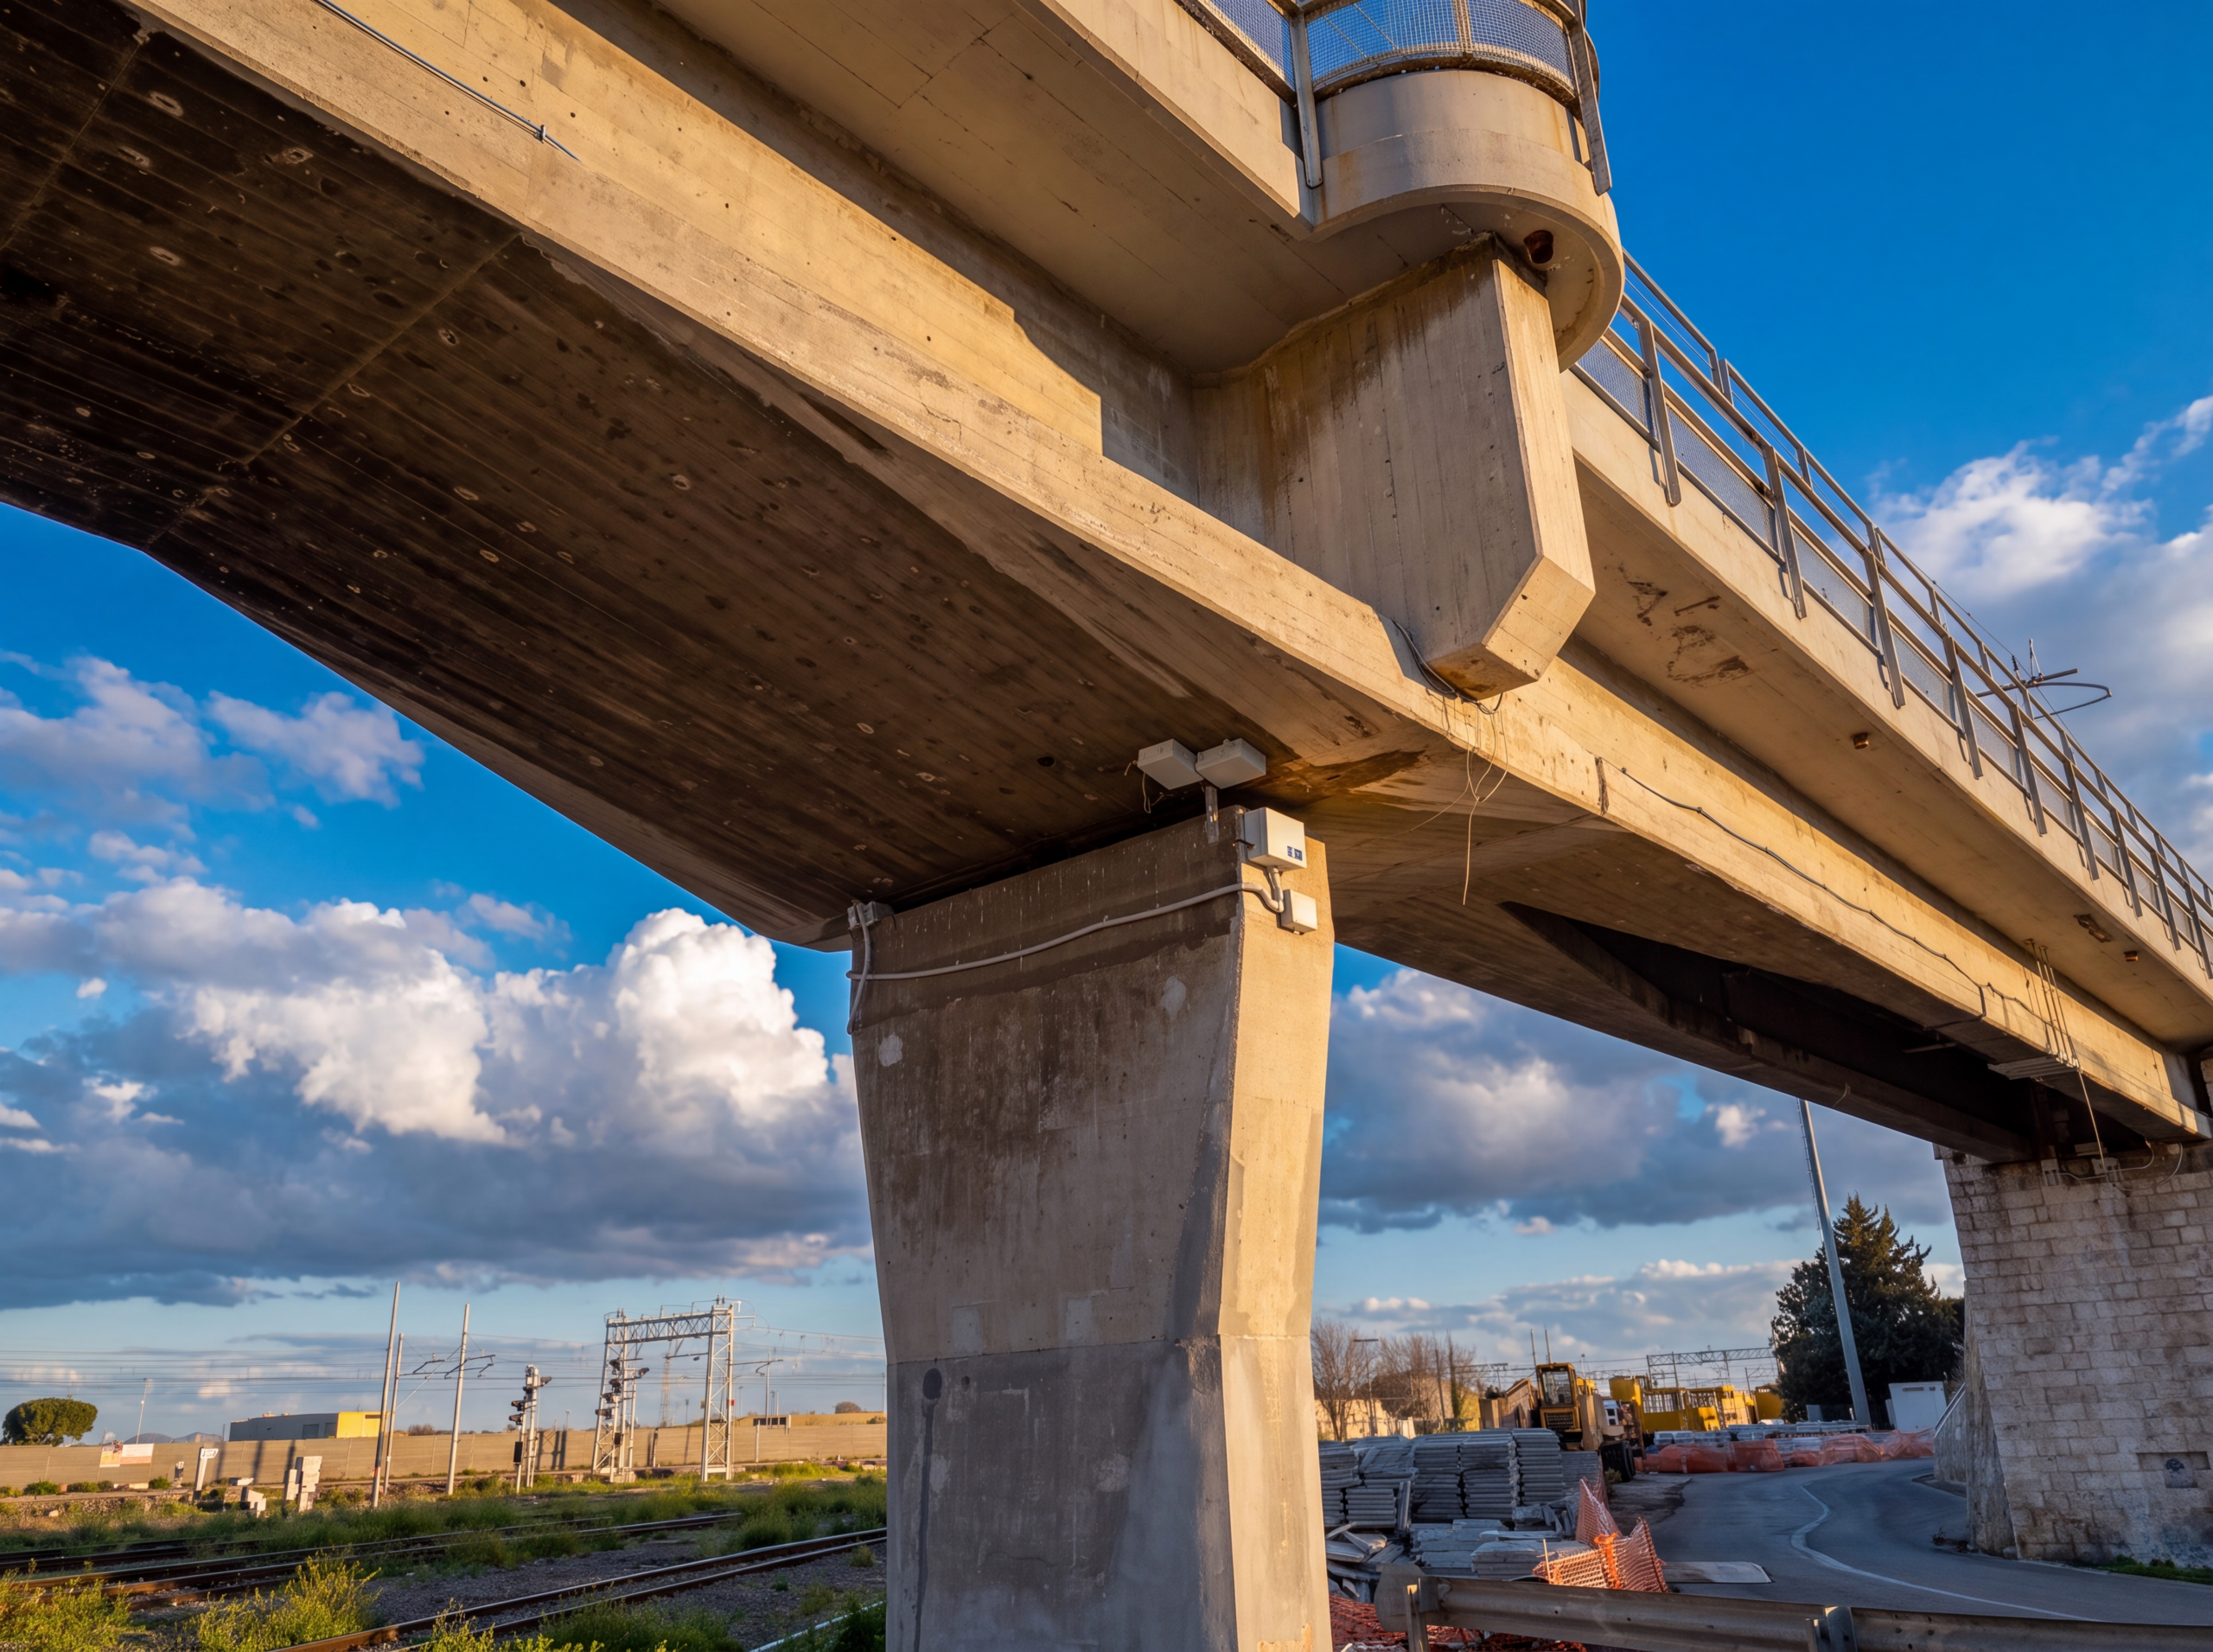
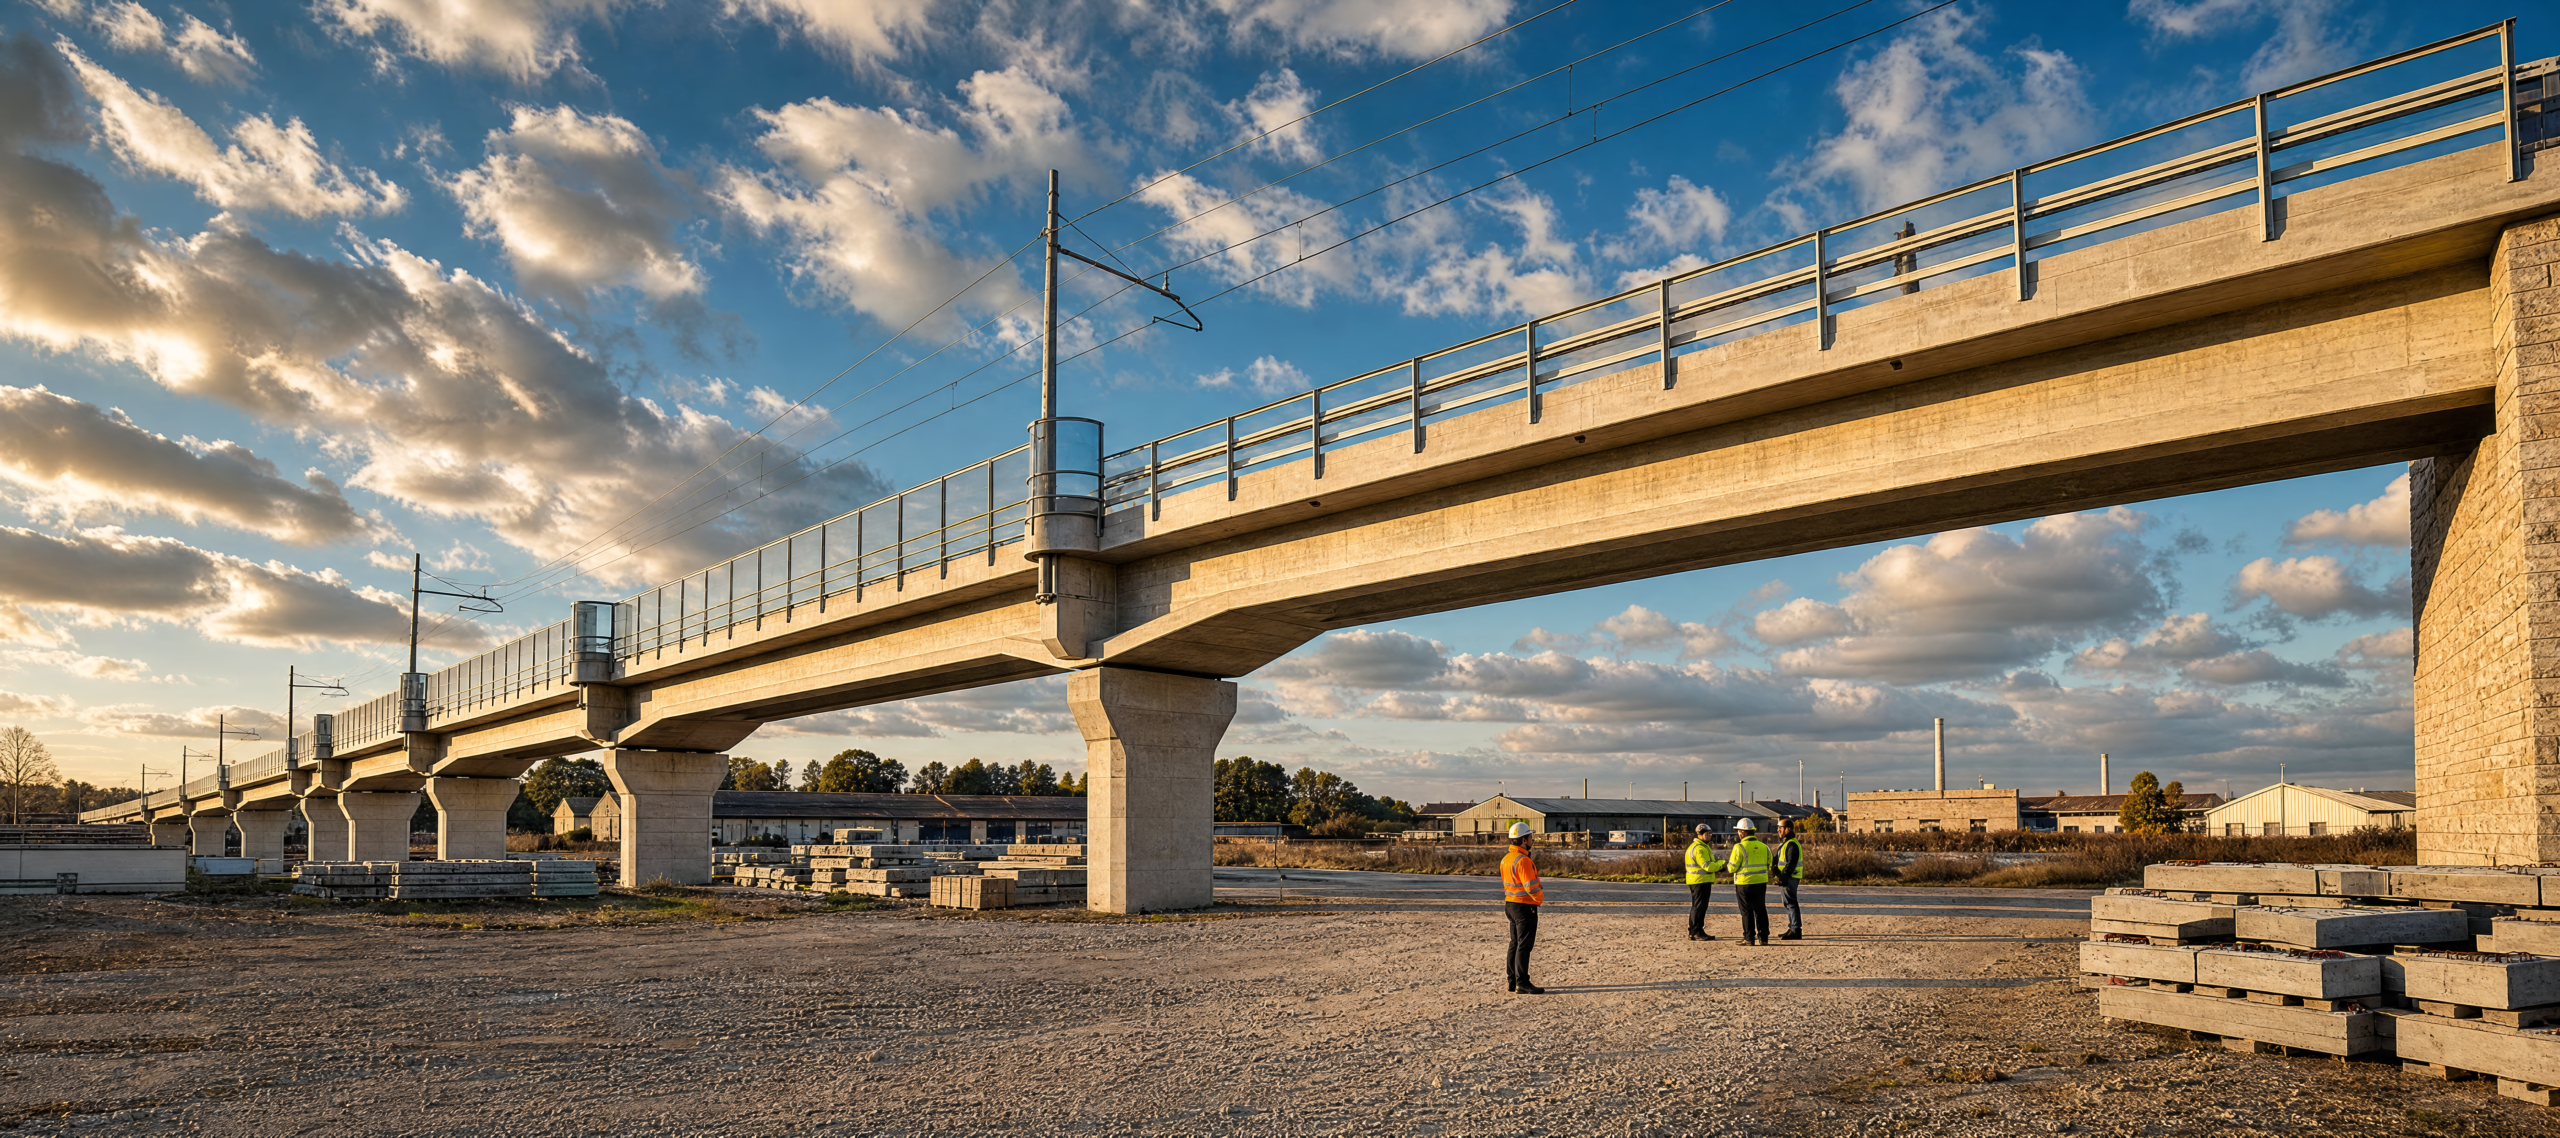
The case study concerns a multi-span railway viaduct. During inspection and structural assessment activities, issues of a static nature emerged, for which structural strengthening measures were planned.
It was precisely in this context that the decision was made to activate a continuous instrumental monitoring system, with the aim of tracking the evolution of the structure’s behavior over time and building an objective data set to support subsequent technical decisions.
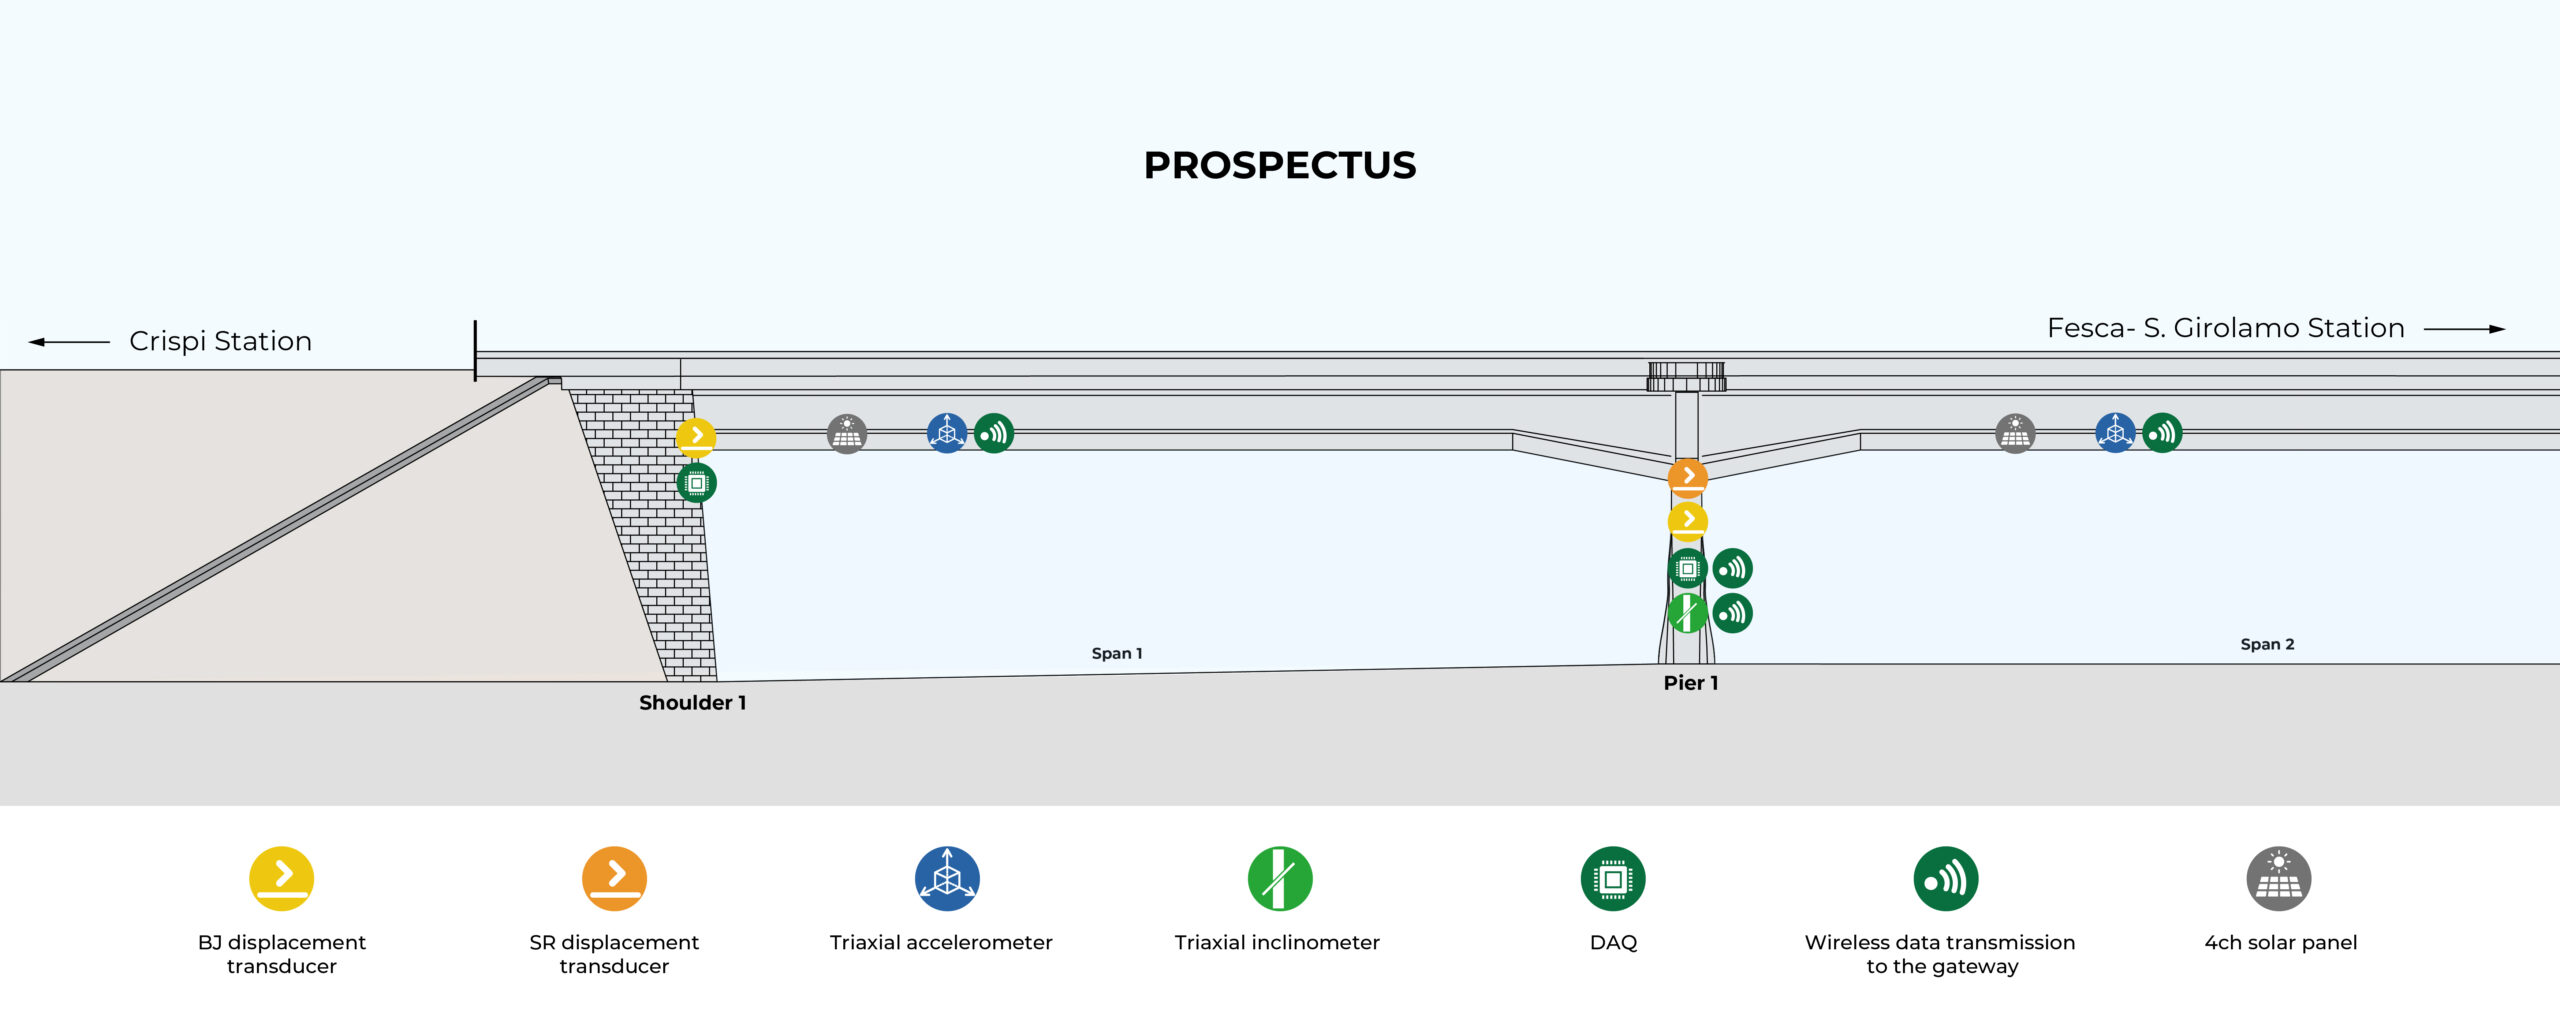
Four inclinometers were installed on the structure, one per pier, together with six crack gauges distributed across the two abutments and the four piers. Each instrument acquires data on three directional channels in addition to temperature.
The inclinometers produce approximately 4,600 readings per day, the displacement transducer over 17,000, for a total exceeding 20,000 readings per day and eight million over the course of a year, automatically stored on a cloud-accessible remote server.
The inclinometers detect rotations at the pier head, making it possible to track over time any angular displacements of the piers under railway loading and thermal variation.
The crack gauges measure relative displacements between the deck and the substructure in the longitudinal and transverse directions, providing direct information on bearing behavior and on the structure’s response to horizontal actions.
To address the need to convert the large volume of measurements produced by the instrumentation into technical information usable within operational timeframes, two processing algorithms were developed — one for the inclinometers and one for the displacement transducer — accessible through an interactive web interface.
The workflow is organized into three sequential stages, each with a specific objective: validating the integrity of the acquired data, filtering it to separate the structural response from dynamic and instrumental disturbances, and returning it in a processed, readable form to support technical judgment.
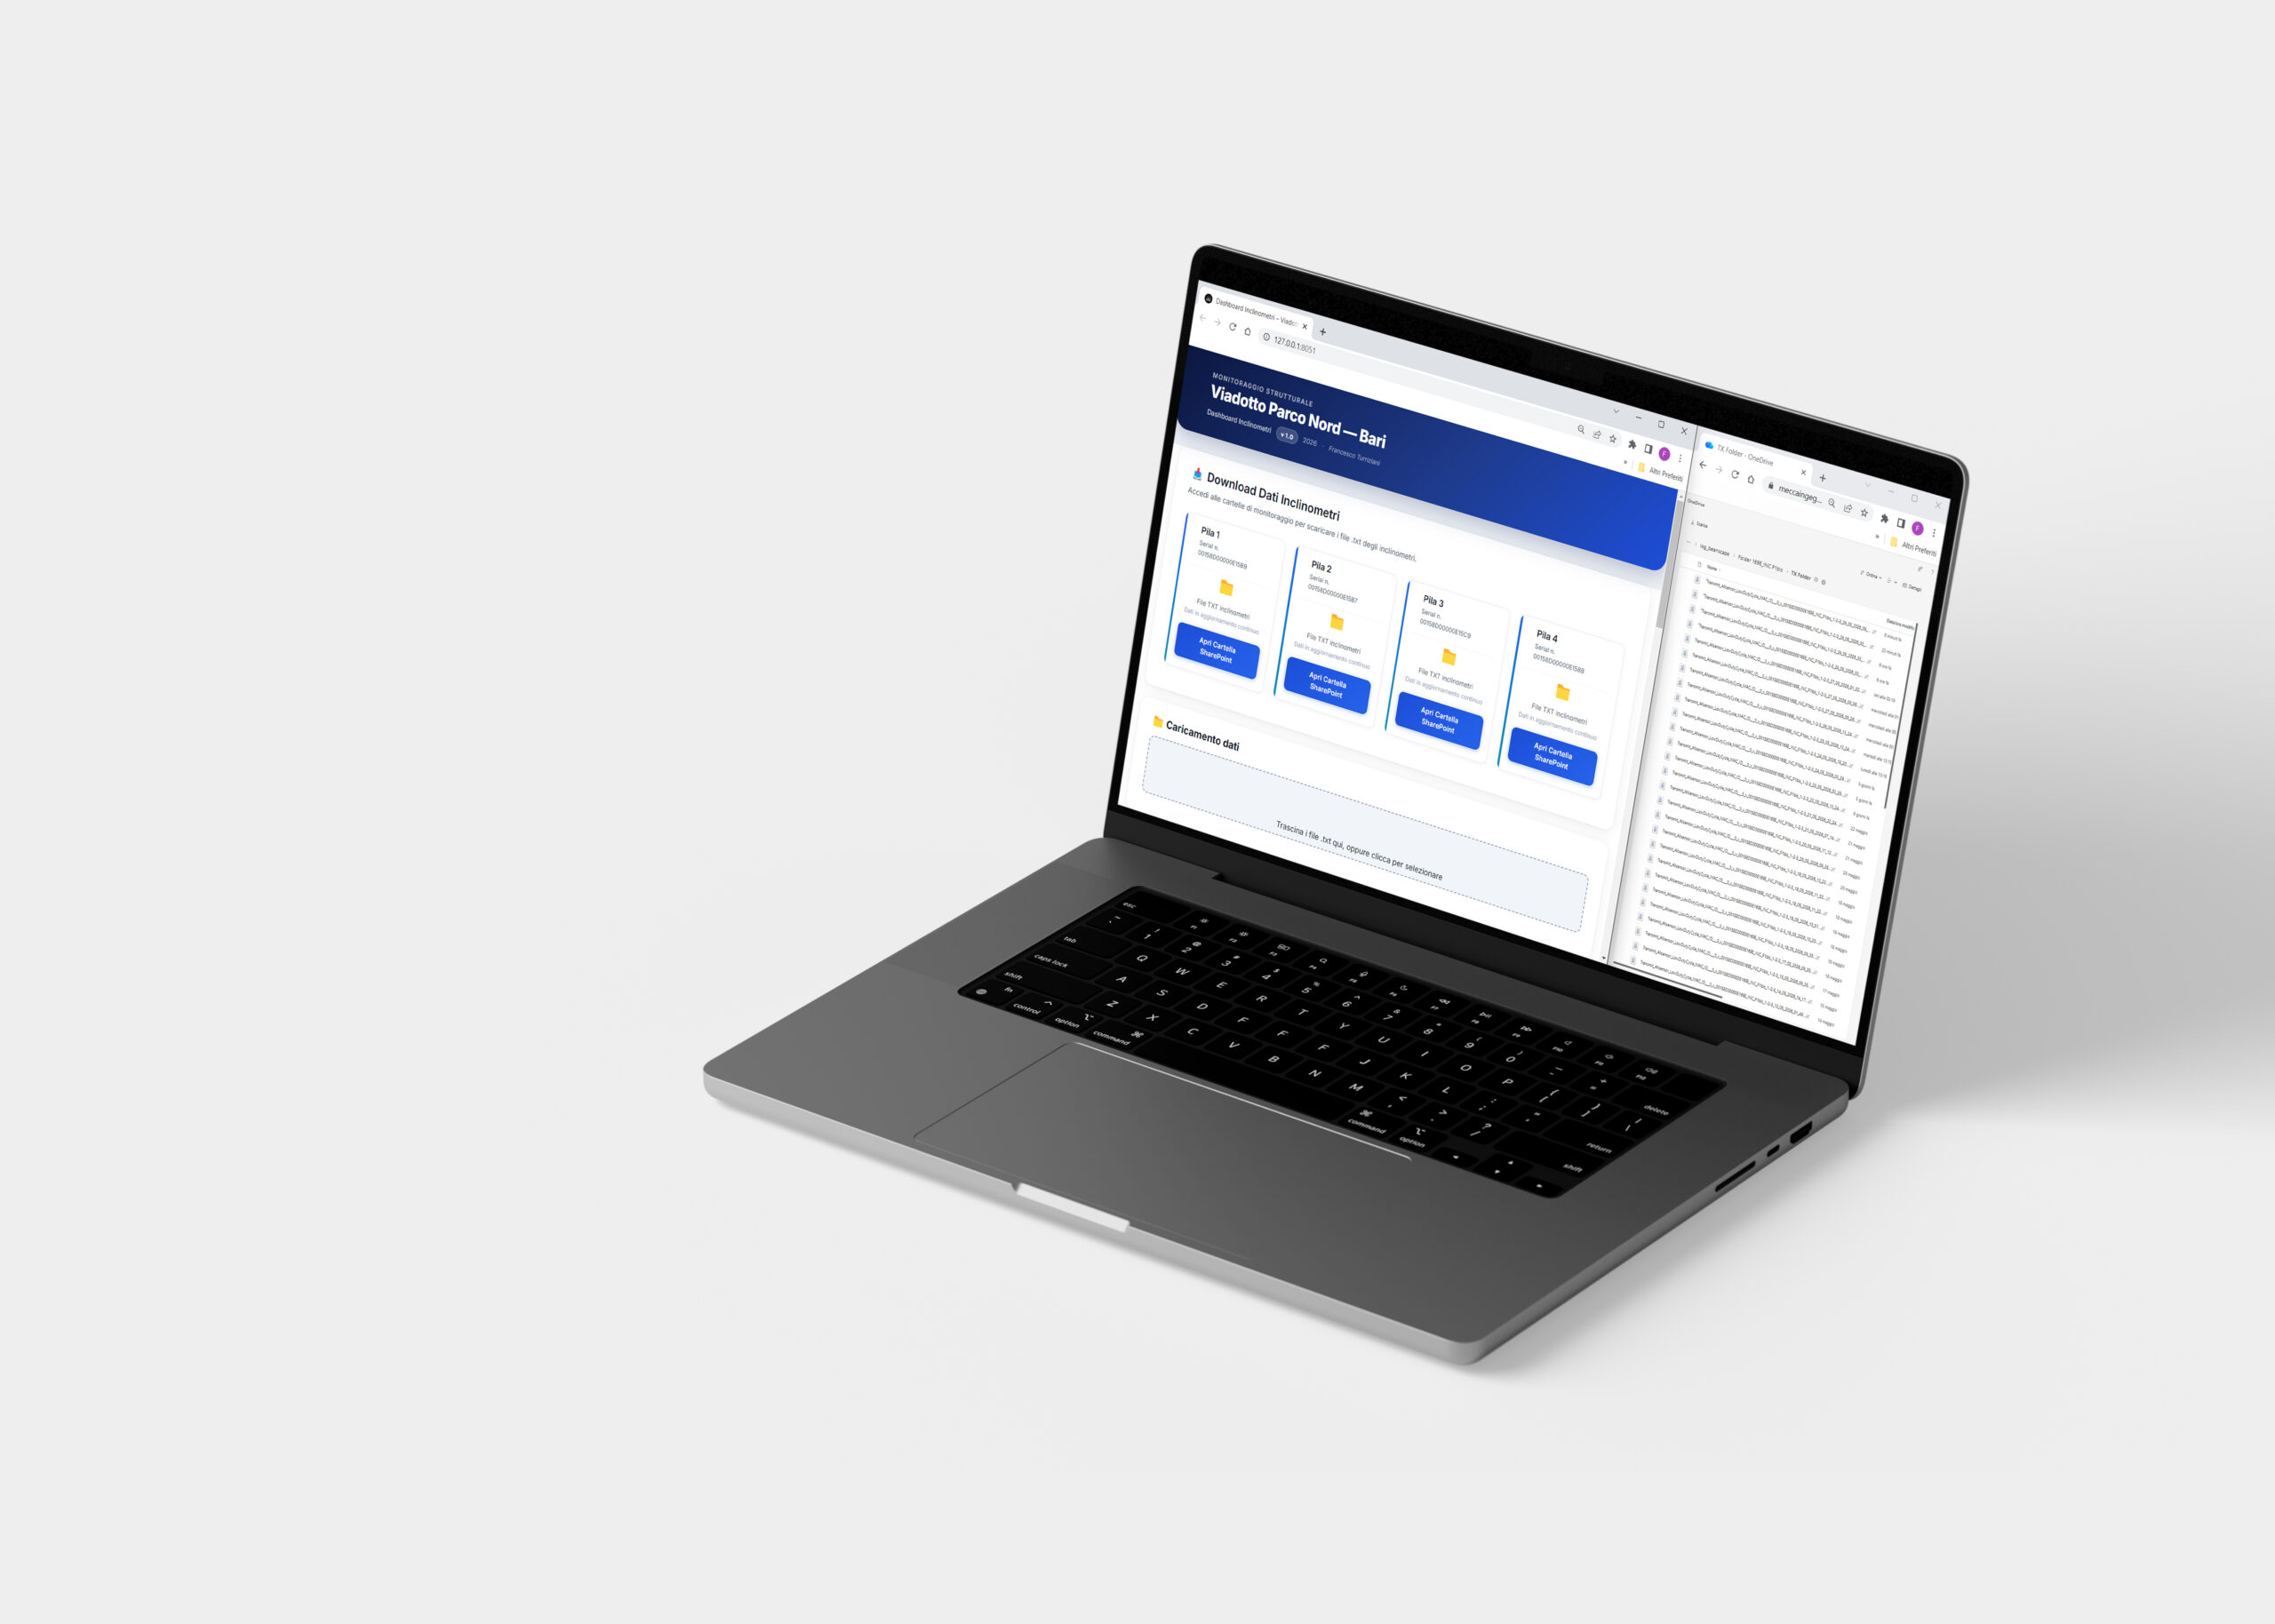
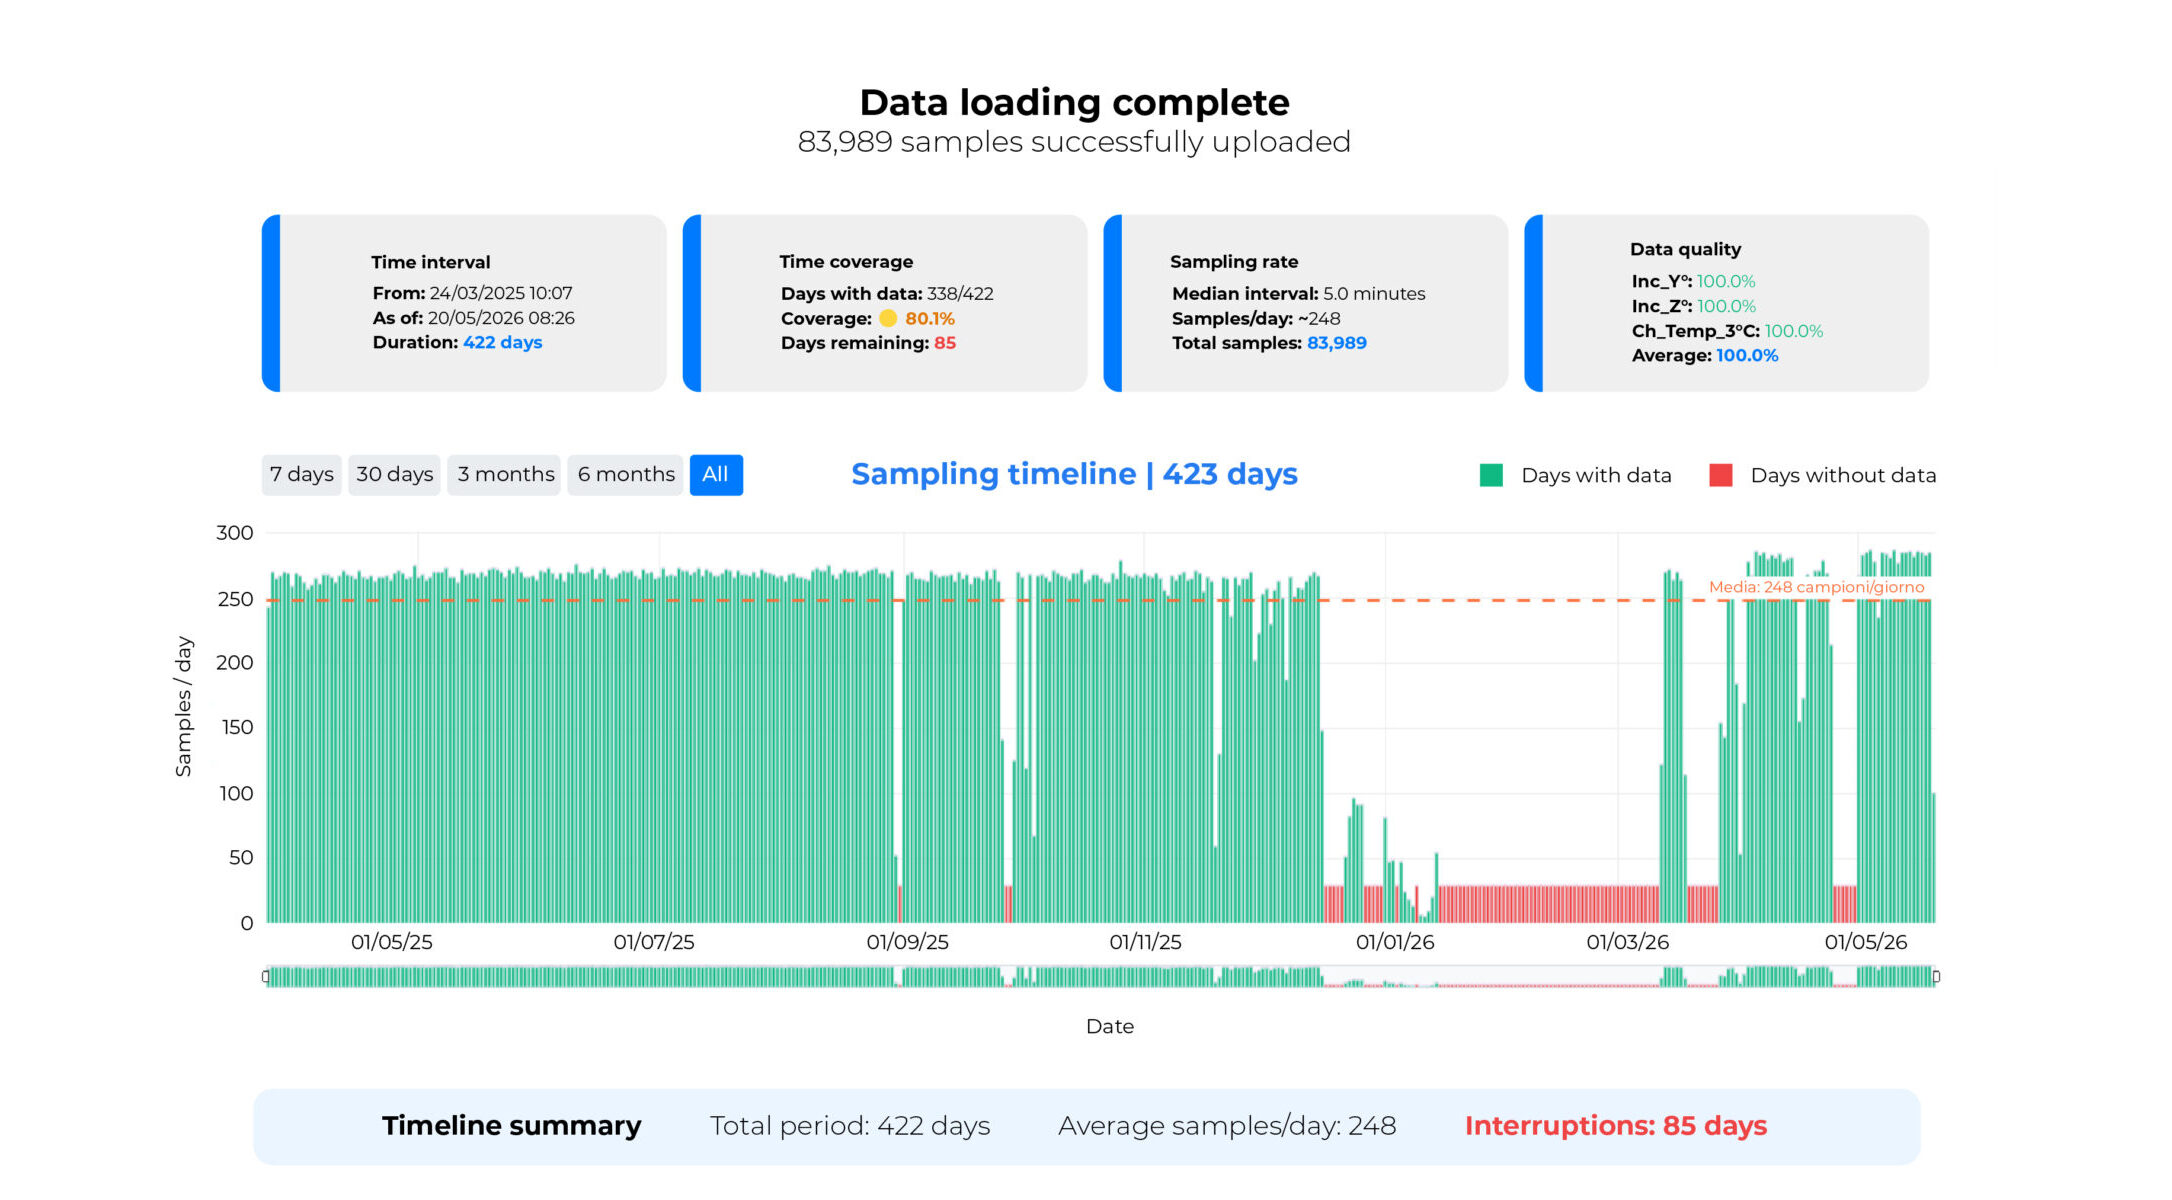
The first step in the processing workflow is validation of the acquisition stream. Before any further processing, it is necessary to verify that the time series are continuous, free of gaps, and consistent with the set sampling frequency.
An undetected discontinuity in the data-storage stream could be mistakenly interpreted as an absence of structural variation, compromising the accuracy of the final technical assessment.
It is also essential to distinguish an acquisition anomaly (instrument fault, communication interruption, maintenance activity) from an actual change in structural behavior, since the two situations call for different technical responses.
The algorithm analyzes the uploaded log files, checks the continuity of the time series, identifies gaps in the data stream, and flags time windows lacking samples.
Results are returned through the web interface: for each channel, the number of samples acquired, the effective time coverage, and the location of any interruptions are indicated.
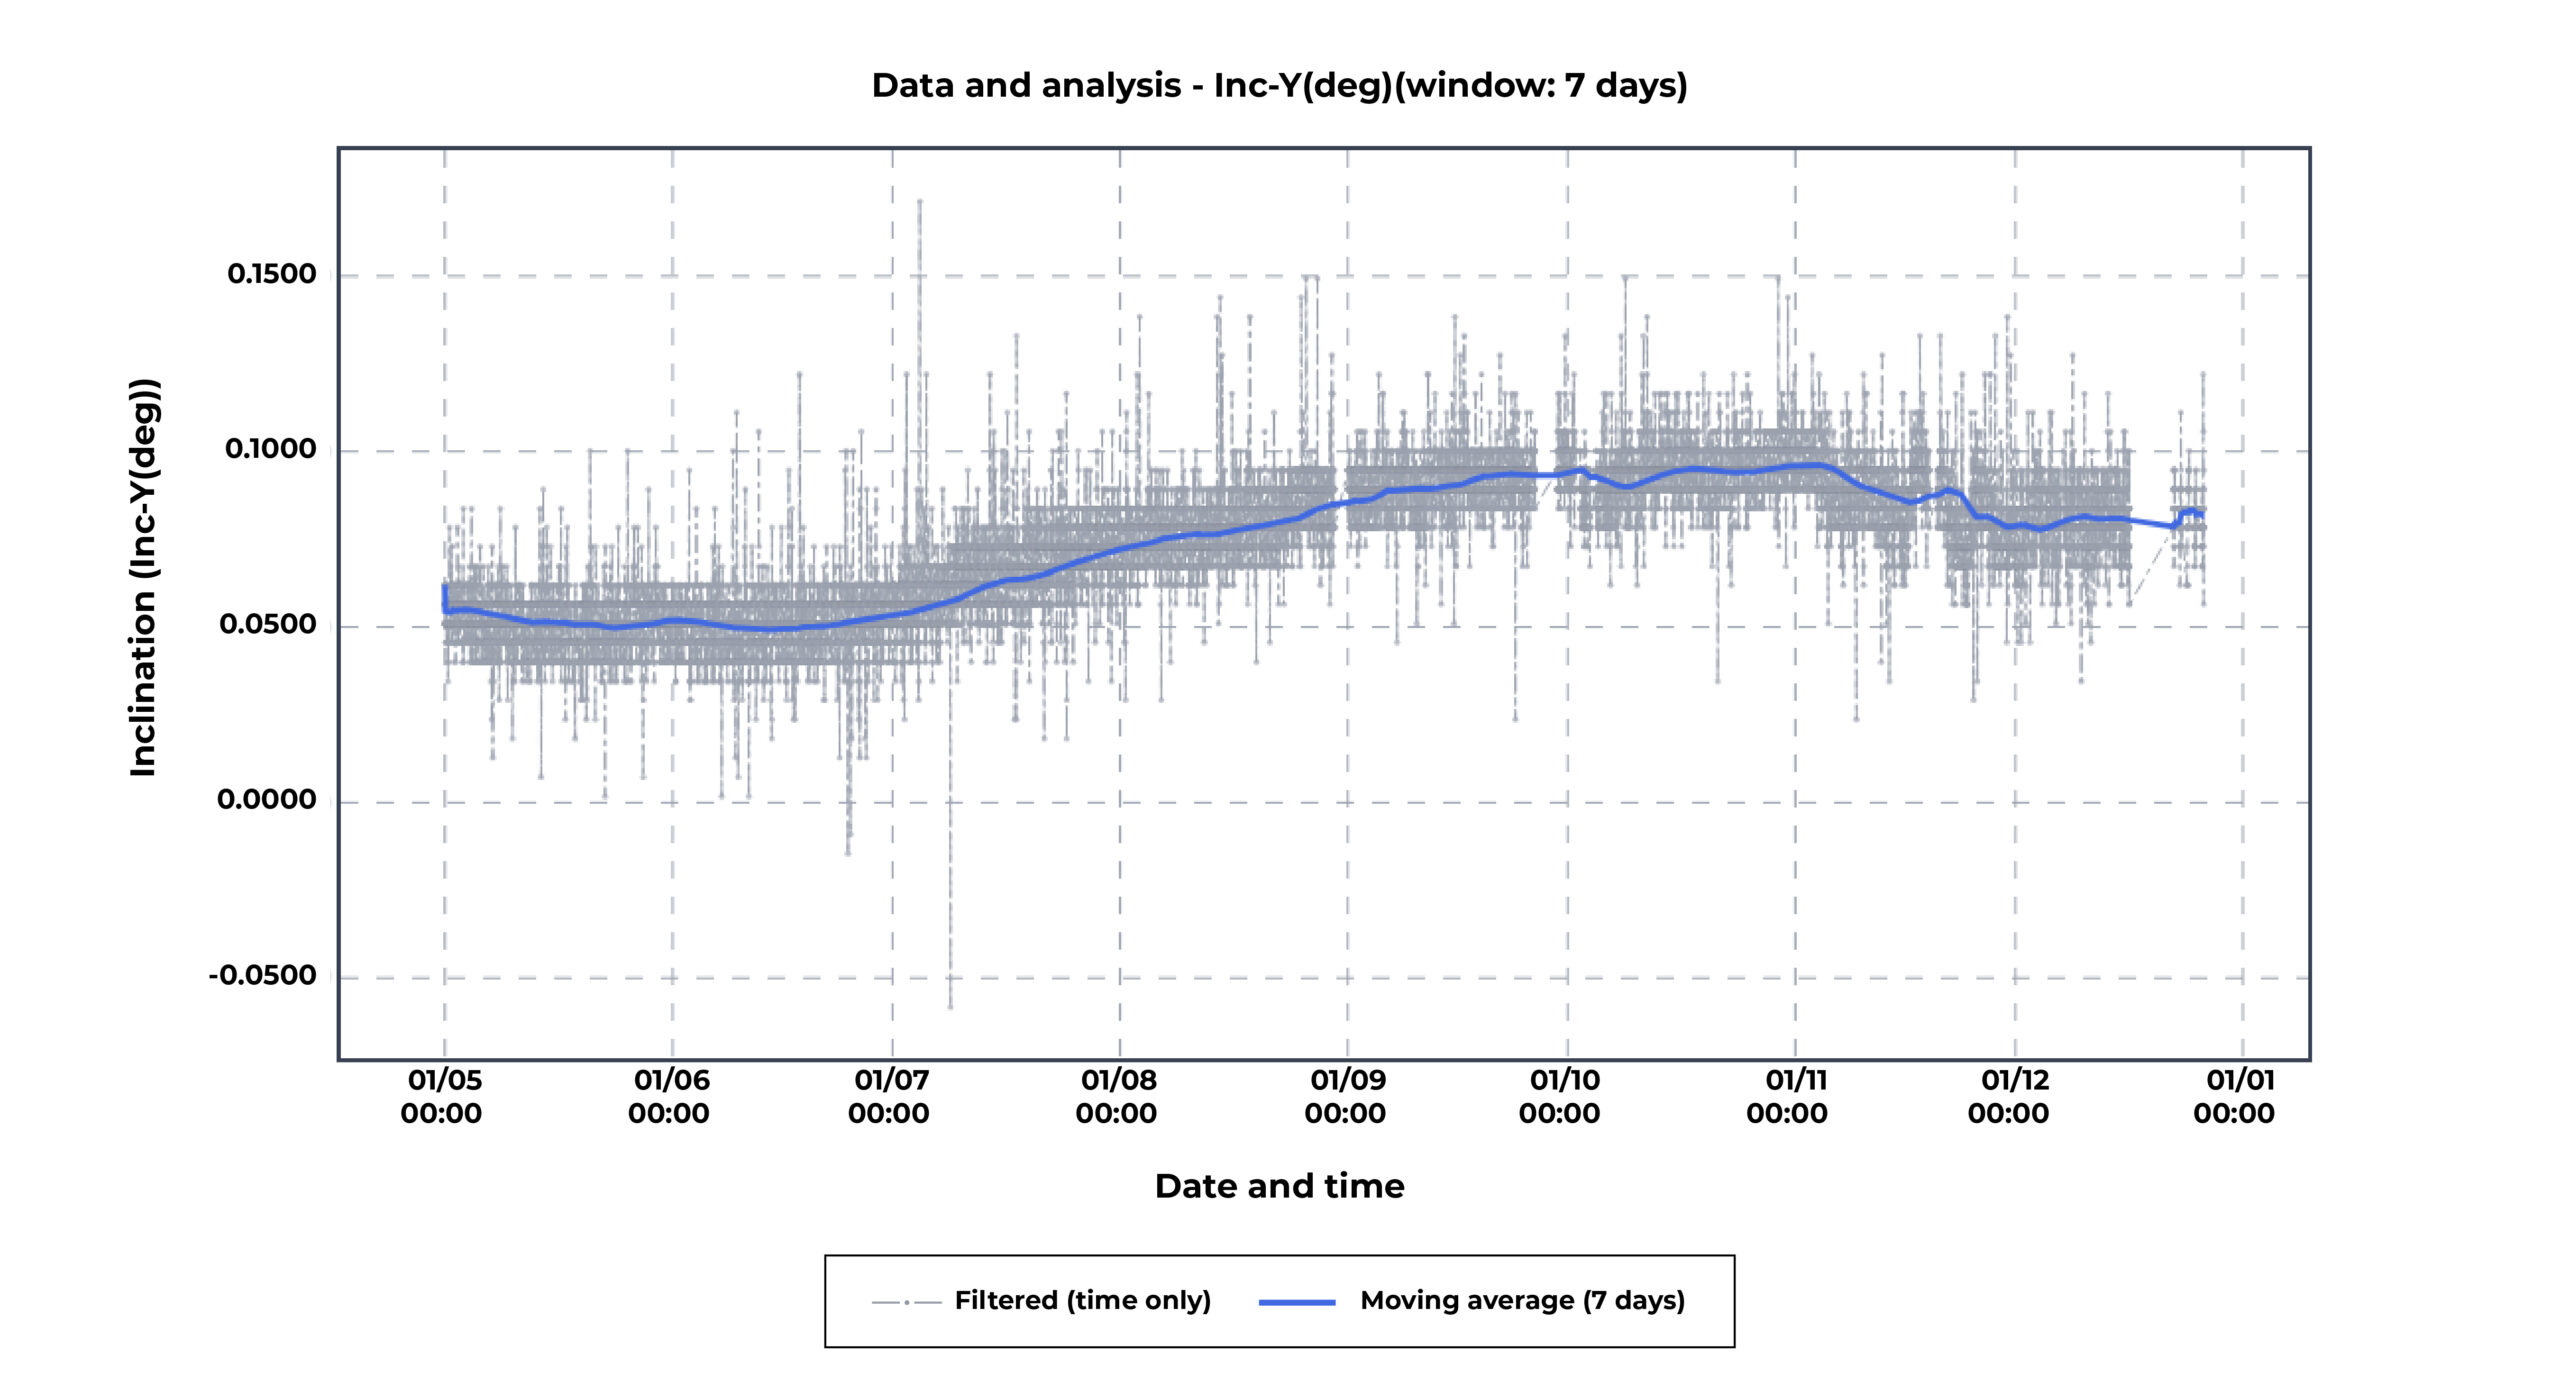
The time series acquired continuously contain impulsive components of dynamic origin, generated by the passage of trains, which are superimposed on the structural response of interest. These variations occur and dissipate within a few sampling intervals and cannot be attributed to the static behavior of the structure. The purpose of this processing stage is to isolate and remove these impulsive components while preserving long-term variations — including those of thermal origin — which constitute an essential part of the structural information.
Among the possible techniques for identifying and removing dynamic transients, the algorithm employs first-derivative analysis of the time series, which makes it possible to detect instantaneous variations incompatible with the structure’s expected response rate.
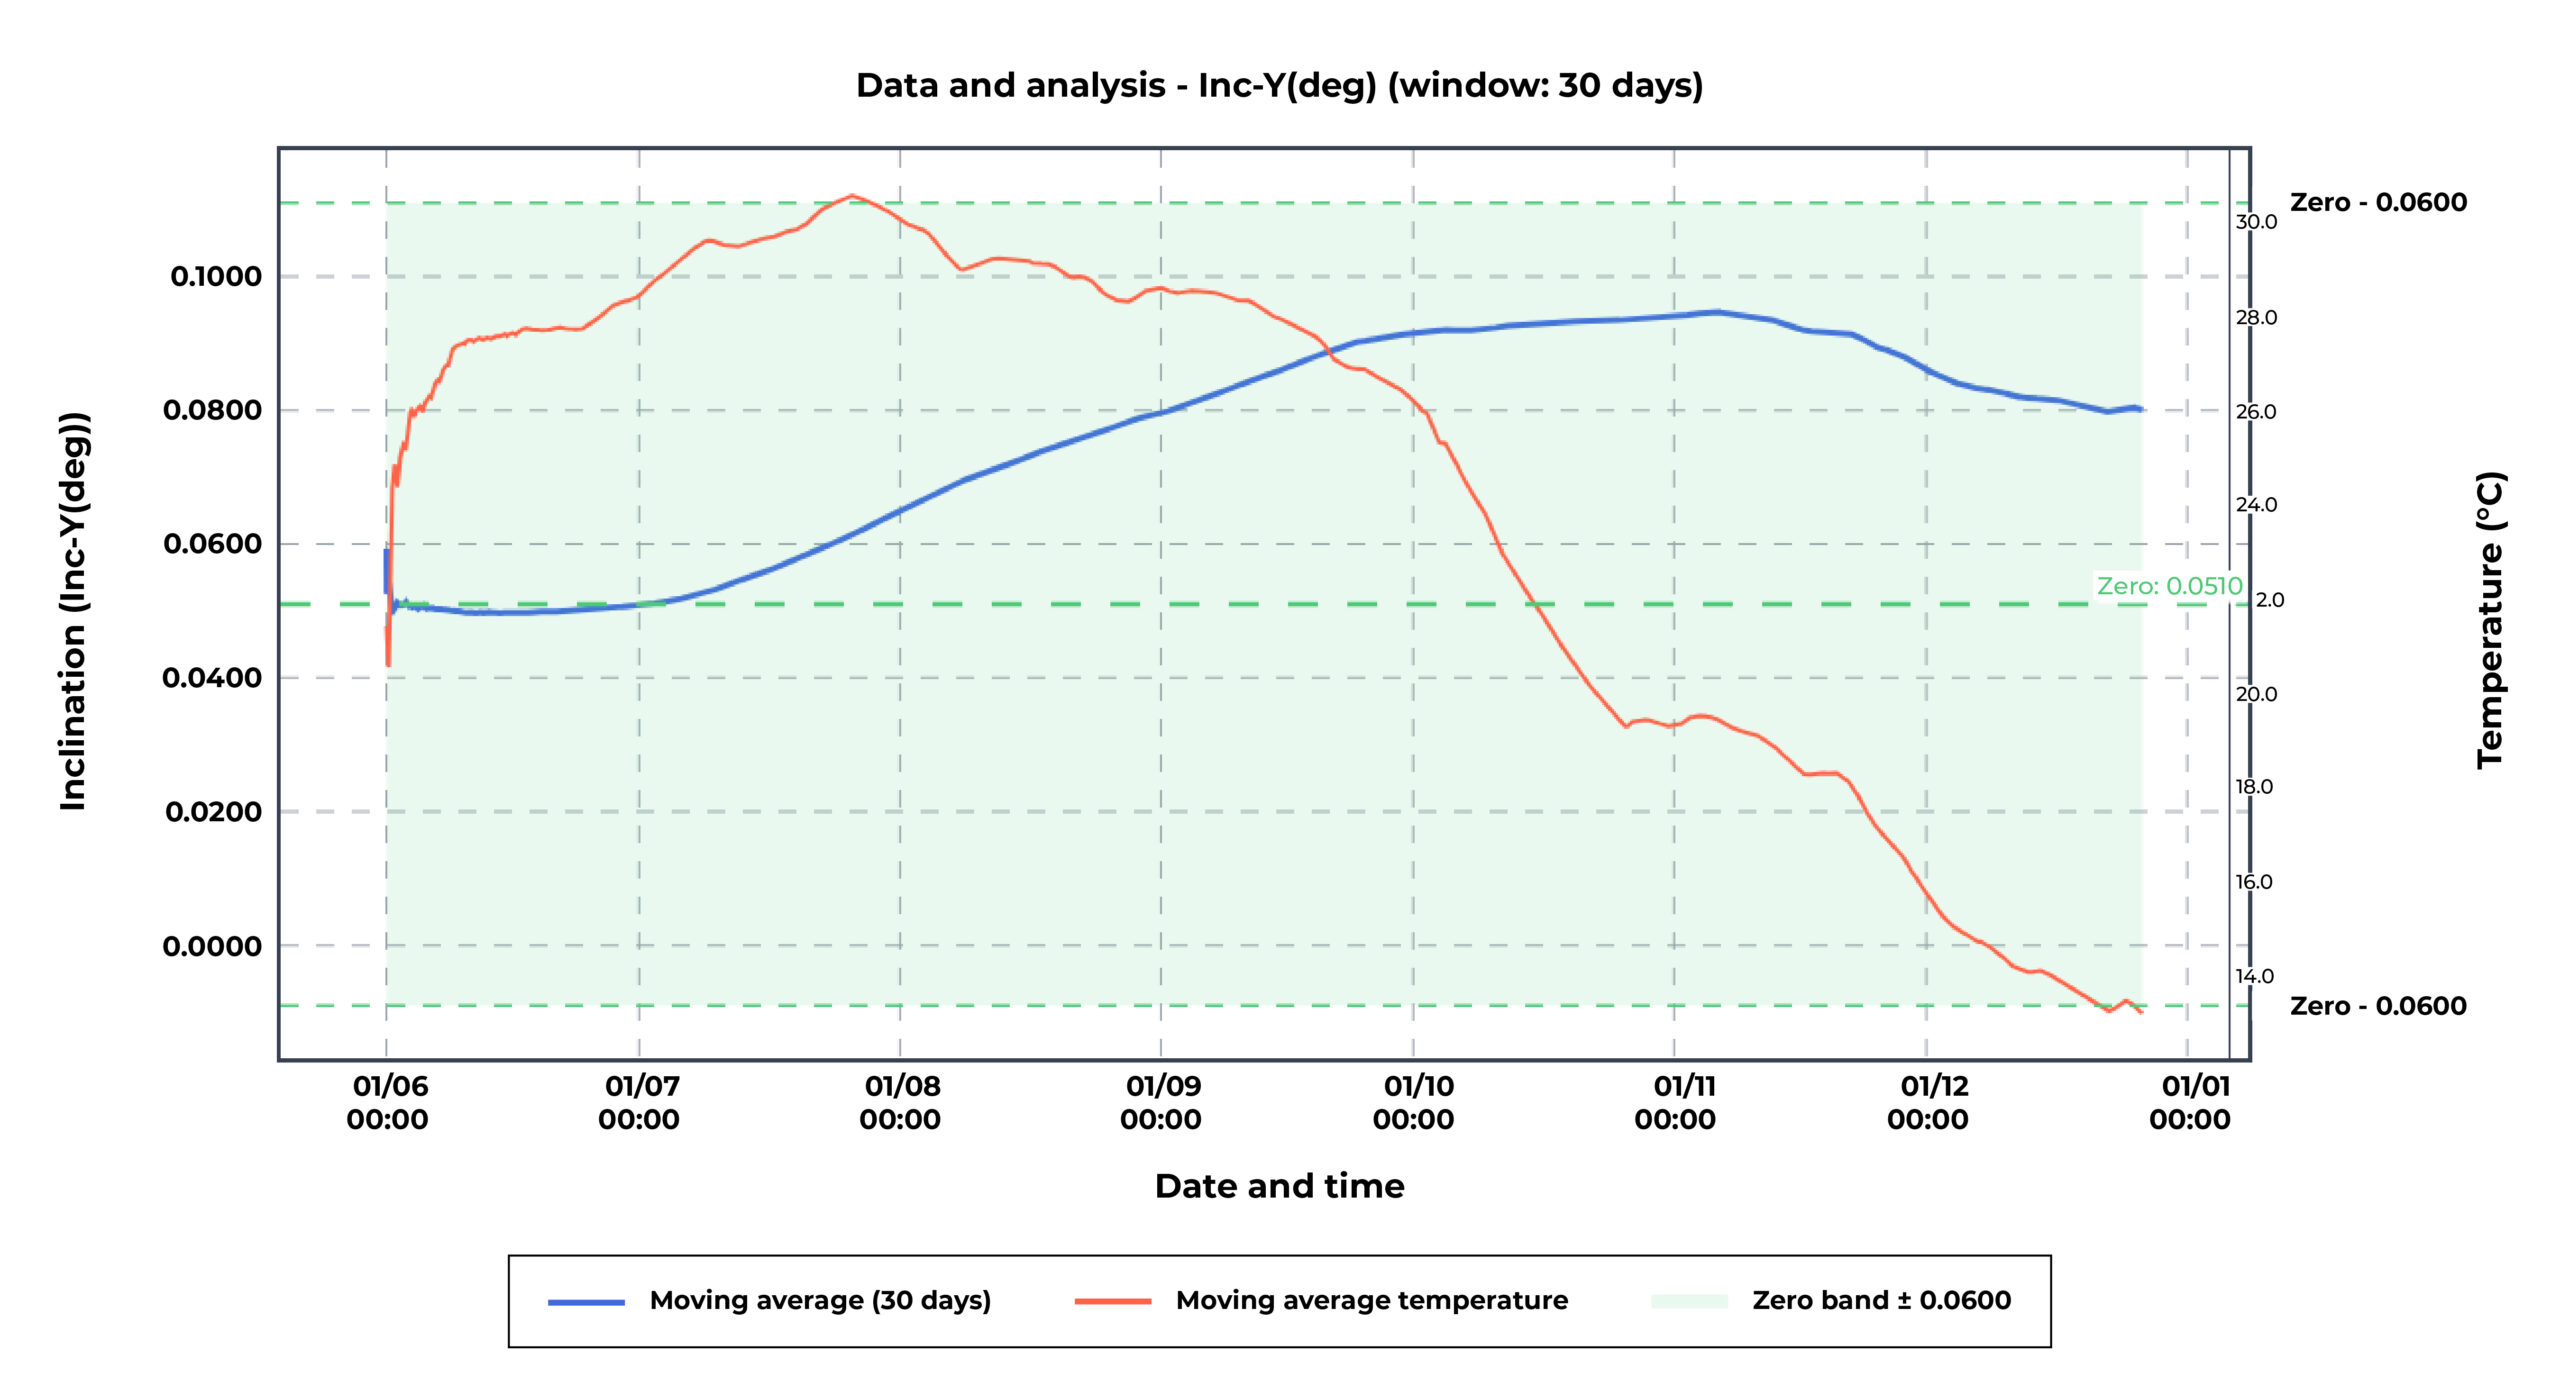
A moving-window trend is then computed on the processed data; the window width is configurable according to the characteristics of the data — for the measurements on this viaduct, a weekly window was adopted, bringing out the long-term structural trend against which checks are performed relative to the attention thresholds.
The processing results are returned through the web interface in interactive graphical form. For each instrument, it is possible to simultaneously display the raw time series, the filtered curves, and the long-term trend, together with the control bands corresponding to the different alert levels.
Having this processed picture available so quickly makes it possible to assess the evolution of structural behavior at a frequency compatible with the operational requirements of asset management.
The control bands are defined on the basis of static assessments specific to each type of measurement and differentiated by alert level. Exceeding a band triggers a corresponding alert level and prompts evaluation of the kinematic indicators.
Alongside the reading of the absolute data value, the evaluation also considers its rate of change over time, i.e., the first derivative of the trend with respect to the time axis.
A curve converging toward the threshold at an increasing rate indicates a structurally more critical condition than one that remains stable at the same absolute value. This trend-based reading makes it possible to detect significant evolving dynamics before the threshold is actually exceeded, widening the available margin for assessing the situation and planning any necessary interventions.
A specific contribution of the interface is the overlay of the temperature trend onto the instrumental series. Seasonal thermal variations significantly affect the measurements of all instruments and constitute a genuine component of the data.
Comparison with the thermal profile makes it possible to recognize variations attributable to known external causes, such as seasonal fluctuations, and to distinguish them from variations that evolve independently of temperature — the latter warranting specific technical investigation.
The interface also allows high-resolution charts and processed series to be exported in CSV format, for use in producing periodic monitoring reports.
The adoption of this process has significantly reduced the time required for the periodic processing of monitoring data, making results available within timeframes compatible with the operational requirements of asset management.
A structured, reproducible process also ensures greater consistency in interpretation over time, regardless of the frequency of the analysis campaigns.
A natural evolution of this approach is the introduction of predictive logic based on kinematic indicators. Monitoring the rate and acceleration of change of the indicators over time makes it possible to detect critical evolving trends before absolute thresholds are reached, widening the available lead time for assessing the situation and planning any necessary interventions.
This principle can be applied directly to the instruments already installed on the structure, without modifying the existing instrumentation.
The next step is to extend this approach to other monitored structures, adapting the algorithms to the instrumental and structural characteristics of each case. A further development concerns the automation of periodic report production: since the processing is already structured and documented, generating the report becomes a largely automatable step, yielding further time savings in reporting activities.
This experience suggests that the value of the instrumentation installed on a structure increasingly depends on the quality of the process by which the data are managed and interpreted. Instrumentation produces data: it is the processing and analysis workflow that transforms it into technical information useful for supporting decisions.